5 Google Analytics Reports You Should Check Every Month
Even if you’re not a data geek like me, when you are the one managing your business’ marketing it’s important to understand what is driving customers to your website, and what is happening when they get there.
So, once a month grab a cuppa and sit down for 30 minutes to check out what’s going on with your website.
Traffic Acquisition Report
How many visitors did I get in the last month?
A new session is when a visitor comes to your site, even if they only look at one page. A session will typically expire after 30 minutes of inactivity, so for example if someone visits your site, goes away, then comes back an hour later, this will count as 2 sessions.
If your marketing is working, you should see a consistent increase in your sessions over time. If this starts to drop off week on week, you might want to re-evaluate your current marketing strategy.
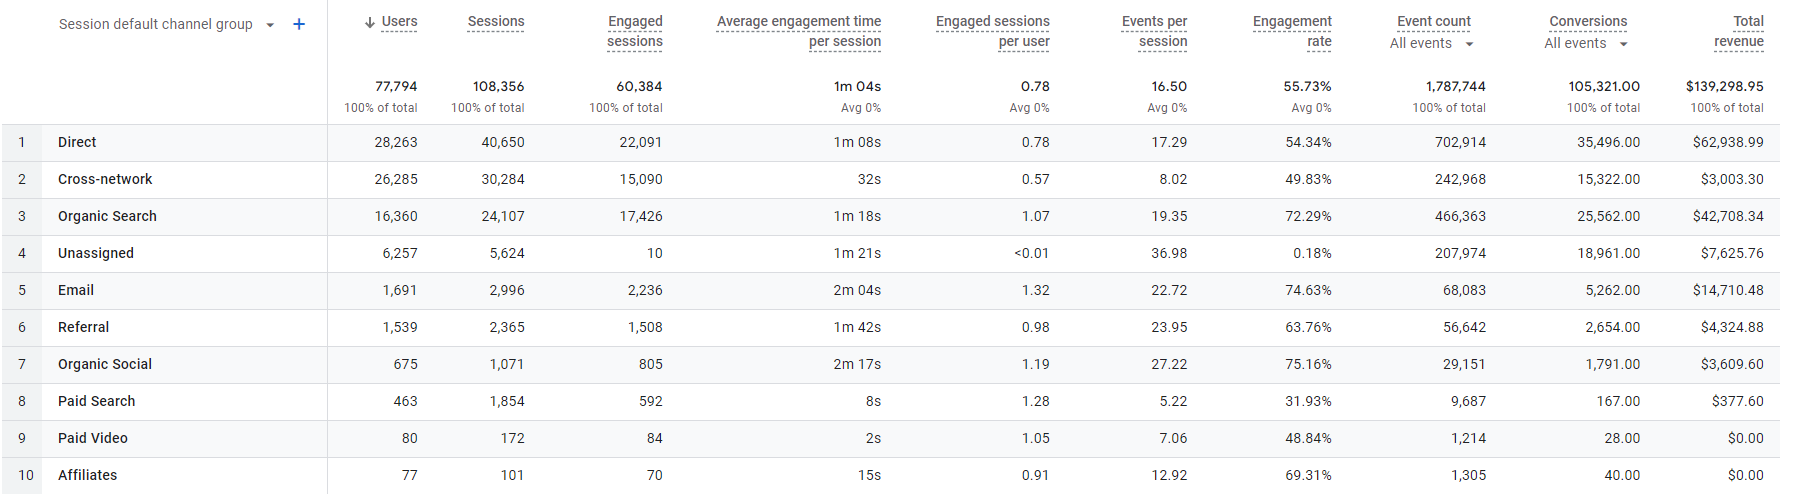
Where did my visitors come from?
Google Analytics is usually able to track where someone came from before they got to your site ie: if they clicked on a link from your Instagram account, this would show up as Organic Social (or Paid Social if it was an ad).
This is a great report to see what channels are successfully driving traffic to your website, and help you to consider where to spend your resources or optimise. Eg: if you are spending a lot of time on Instagram content, but it is not driving traffic, you might want to think about whether you are reaching the right audience on that platform, or whether you are producing the right content that engages them to come to your site.
You’ll want to understand the difference between direct traffic, organic traffic, paid traffic and referrals.
How many visitors engaged once they got here?
An engaged session is defined as a session where the customer stays on your site for 10 seconds or more, or when they look at more than one page.
Looking at your engagement rates for various channels is very important to understand – particularly if you are using paid ads. There is little value in paying for ads to drive traffic if those customers are not engaging once they get to your website.
Landing Page Report
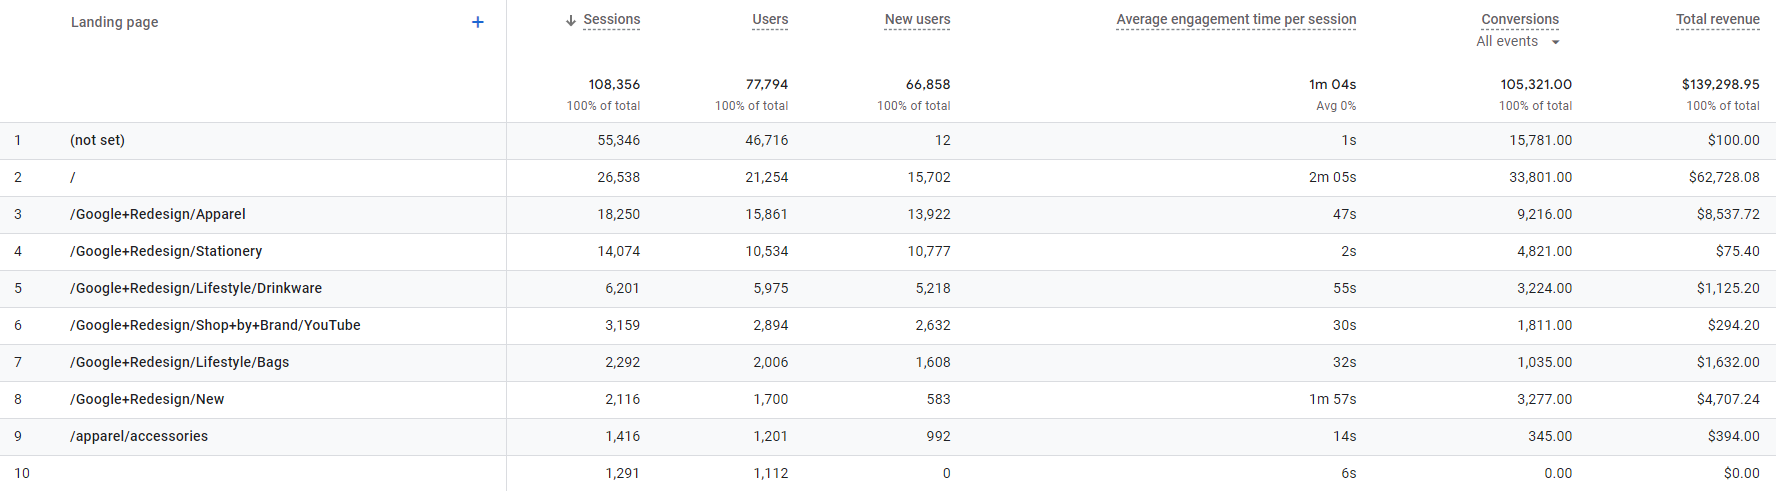
What pages on my website are people landing on when they first arrive?
Often when we build a website, we imagine that everyone will come in “through the front door” ie: to our website’s homepage, but that isn’t always the case! It could be that a certain product or blog post is driving lots of organic traffic, or perhaps a landing page for a particular advertising campaign is doing really well.
If people are coming in through other pages, make sure you take a look at those pages and figure out why they are doing so well – hopefully you can apply those same lessons to pages that aren’t performing as well.
Do they hang around when they get here?
When people come in through other pages, do they have a high engagement time? Take a good look at these pages and ensure there is a captivating call to action to get them to engage with more content and convert!
Tech Overview Report
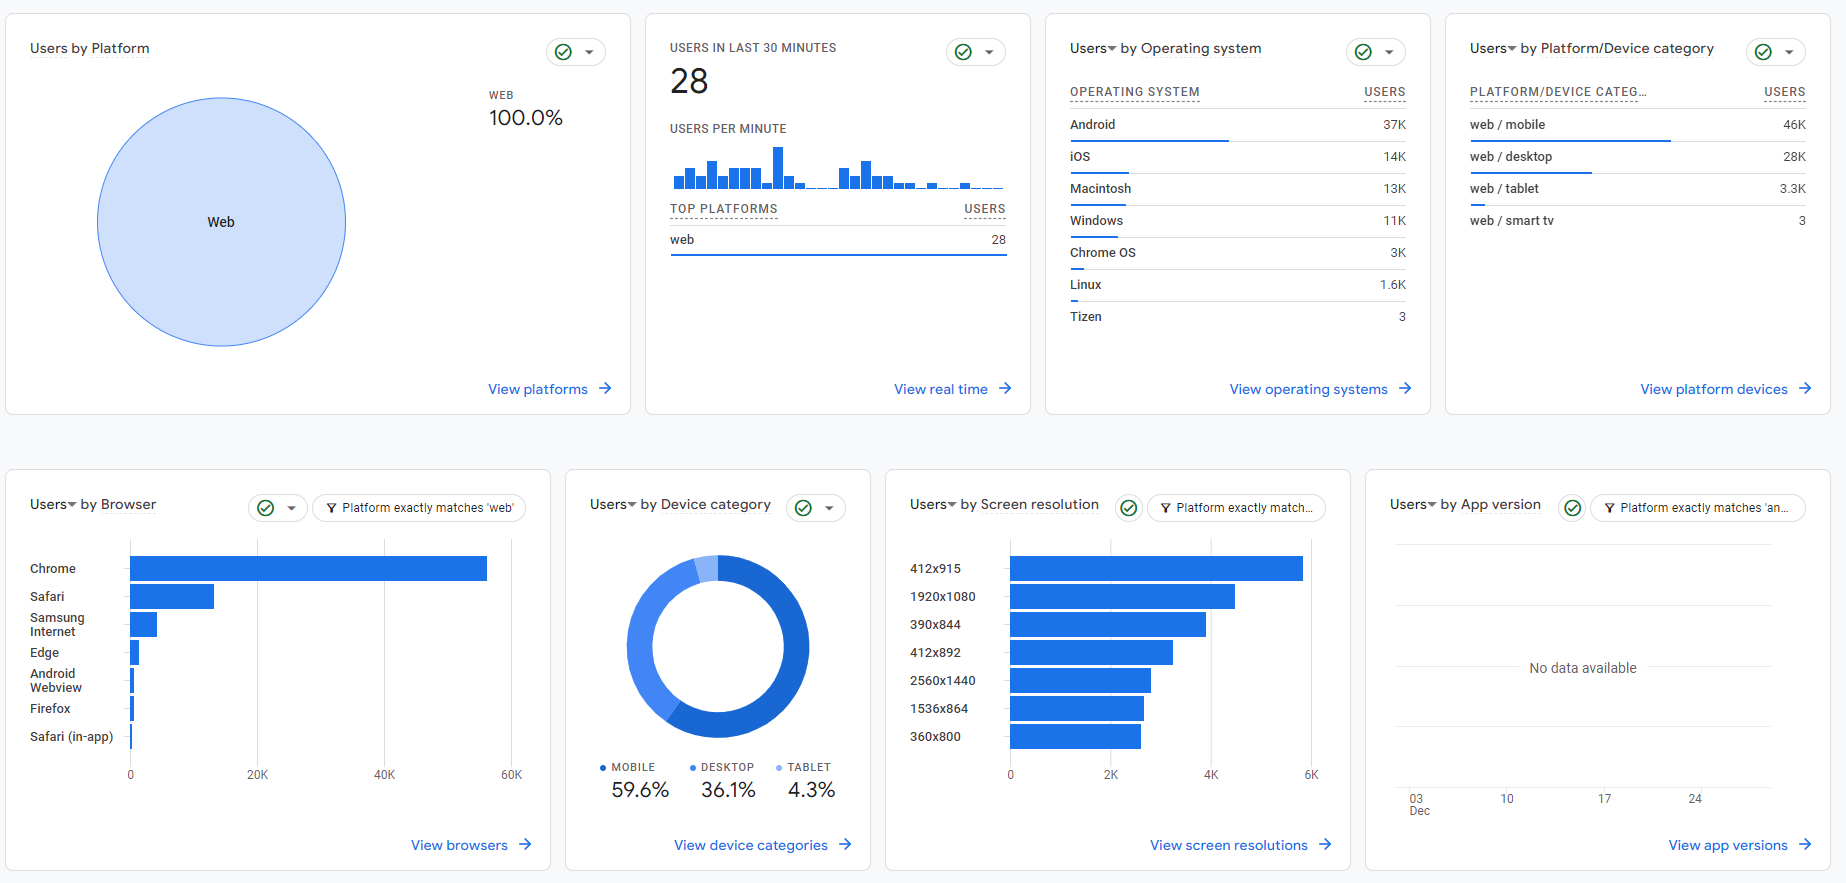
What type of device are people using when they visit my site?
When you’re building pages for your website you mostly do it on your laptop, right? It’s so easy to get caught in the trap of optimising your website for desktop devices, when for many businesses and marketing strategies you may find most of your traffic comes from mobile devices.
In the tech overview report pay special attention to the “device category” report to understand what devices your customers are visiting from. If, like the site below, you find that a large percentage of your traffic is coming from mobile devices, ensure that you always build and optimise your pages first in mobile view and then tidy up for desktop instead of the other way around.
Need Help?
Are your analytics and website set up to capture all the right information to help you to really understand customer behaviour? We can do an analytics deep-dive to ensure everything is set up correctly, and provide some baseline metrics to help you get started.
Purchase Journey Report
If you are selling products on your website, this report is worth its weight in gold.
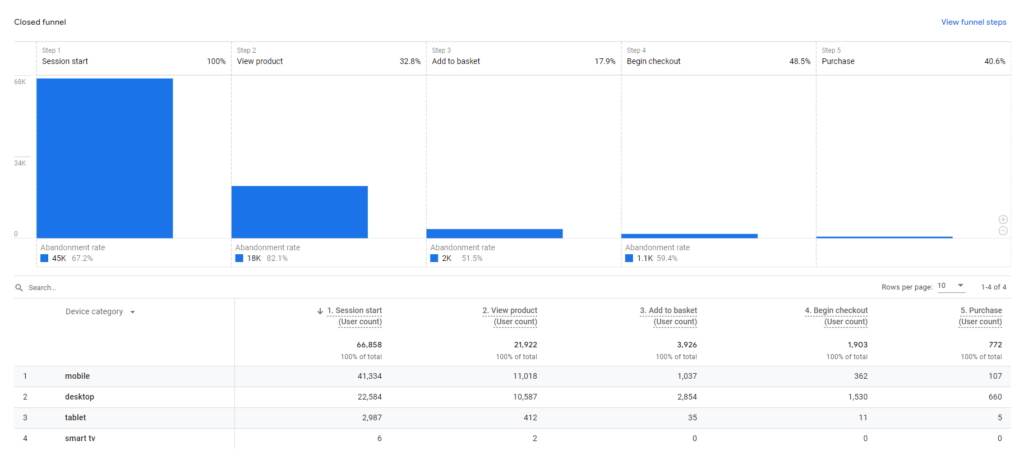
What is stopping customers from purchasing my products?
At each stage in the purchase journey you will always see some drop off in customers (abandonment), and it’s important to understand what is typical for your business. However, you should always be working to optimise! If you see that a lot of people are viewing products, but not adding to basket,perhaps your product images or descriptions aren’t compelling enough to get someone to actually purchase. Or maybe you could try changing the location or colours of your “Add to Basket” button to make it more prominent. If people are starting the checkout process but not completing, is there something that is making the process too hard for them?
Search Console Queries Report
Search Console is another powerful tool from Google that needs to be set up and configured separately to Google Analytics. However, once set up you can connect to Google Analytics so that some of the key reporting feeds through.
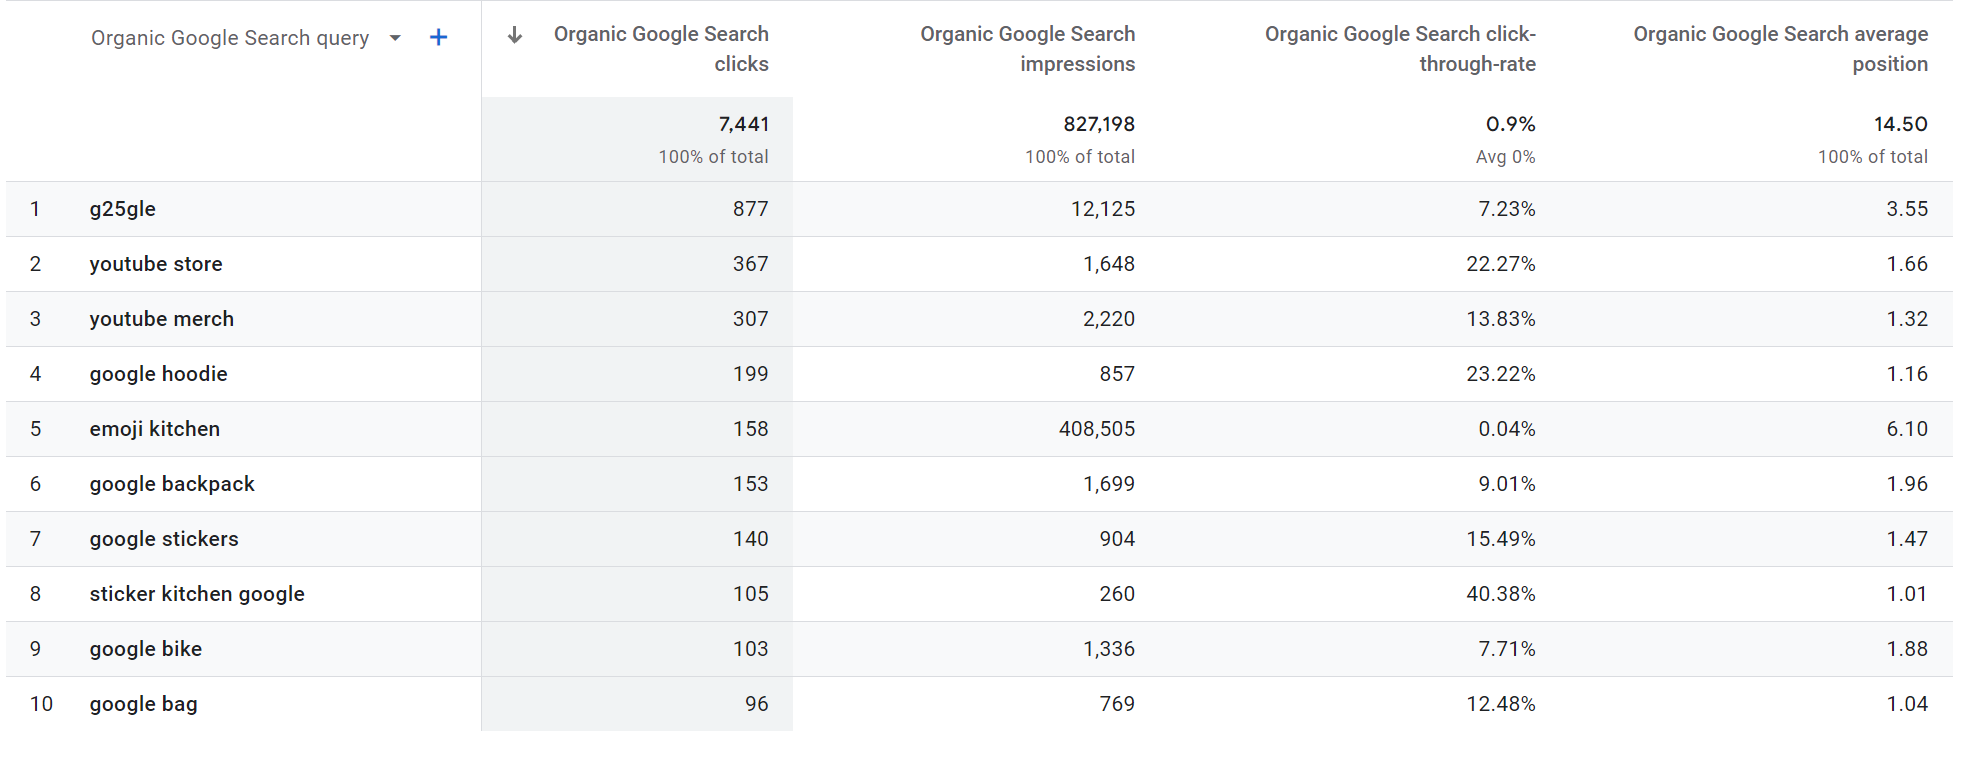
What keywords are showing my site in search results?
The Search Console Queries report shows for different Google Search queries, how many people saw your link (impressions), how many clicked on it.
If the keywords you expect are not showing up in the list, then you will need to work on providing more valuable content on that topic to ensure that Google is including you in search results.
If you have a lot of impressions, but not many clicks, it might mean that the way your site is displayed in the search results is not engaging customers to visit. Look at your title and meta description for the relevant pages to see if there is room for improvement.
Over time, as you optimise your website content, you should start to see the right keywords with more impressions, and more clicks.
How high am I ranking for those keywords?
For each of your keywords, what was the average position? If you are in the top 10, that means you’re on the first page of search results! Congratulations!
Over time, track your most important keywords and optimise your website content to increase that ranking over time.
Final Words
Regularly reviewing these five key Google Analytics reports can significantly impact your business’s success. Making strategic adjustments based on these reports ensure your online presence resonates effectively, driving increased traffic, engagement, and conversions. They’re not just numbers; they’re the roadmap to enhancing your digital presence and business growth.
Need to outsource?
If you’re too busy working on other areas of your business to take a look at the data, we’ve got you covered! We can do the heavy lifting for you and provide a monthly analytics report with actionable insights so you can get right down to business.